

In this article, a series of online and free function graphers to use.
When studying mathematics, it’s always best to have supportive tools. We’ve made available an online and free scientific calculator on Mentes Liberadas. We’ve also covered matrix calculators. However, another essential tool is the function grapher or function calculator.
It’s crucial for understanding mathematical functions. Since drawing graphs by hand takes a lot of time, there’s nothing better than having one or more function calculator.
Therefore, it’s valuable to have graphing software on your PC, tablet, or mobile phone to graph from there.
Now, let’s look at some excellent ones to use online.
1. Graphing Calculator FooPlot
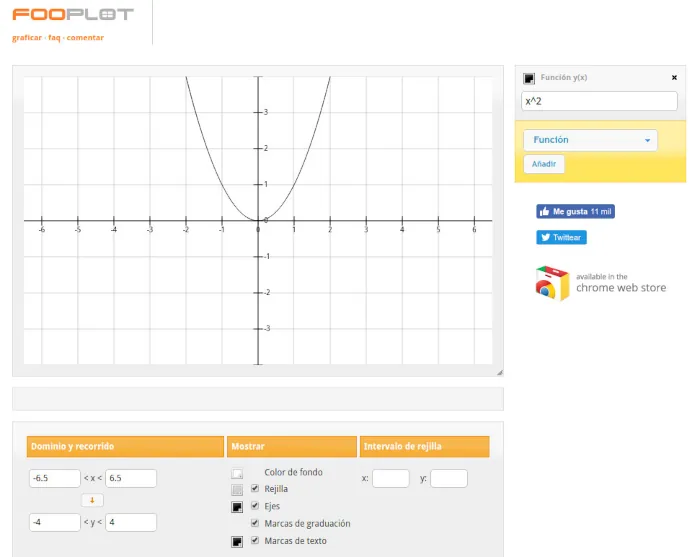
It allows you to graph up to four functions and navigate the graph freely, as well as zoom in. Cartesian coordinates, as we usually do with x and y, can be entered in parametric form or polar coordinates. FooPlot has additional features, such as detecting roots and intersections.
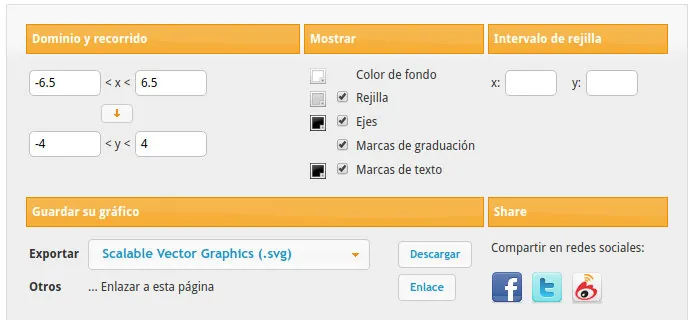
And best of all, it allows you to export the graphs in SVG, PDF, PNG, or EPS format.
2. Function Evaluator and Graphing Calculator

With a simpler interface, this Function Evaluator is still very useful. It allows you to graph up to five functions simultaneously. You can adjust the x and y intervals or define the number of points per curve. An interesting feature is the ability to switch the graph from Cartesian to polar coordinates.
3. Desmos Graphing Calculator
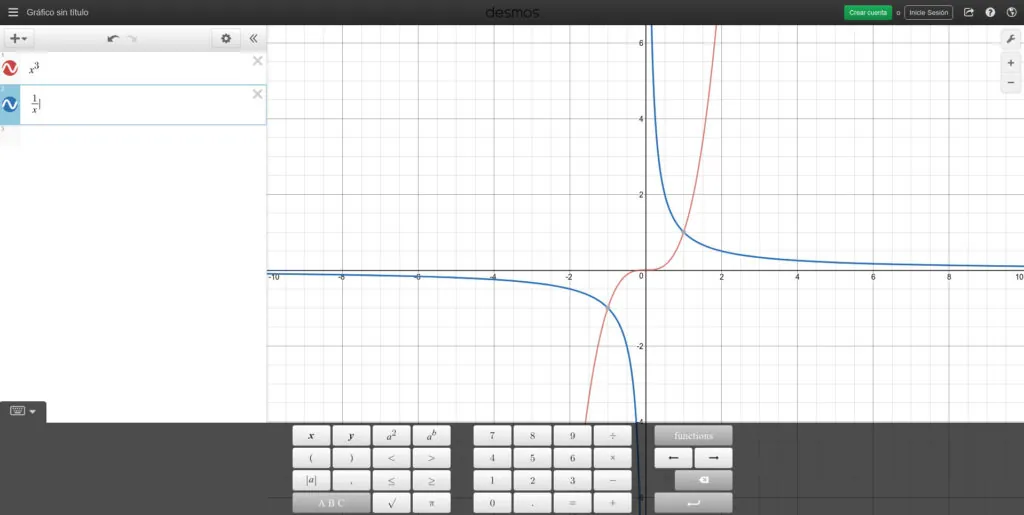
Desmos Graphing Calculator is one of the most comprehensive graphing calculators you’ll find online. The grid occupies the entire screen and includes a powerful assistant to create expressions. We’ve dedicated an entire article to it because it truly offers many options.
4. Graph.tk Graphing Calculator
Graph.tk is a full-screen graphing calculator. It’s quite similar to Desmos. It allows you to build expressions quickly and easily, and even has a console for entering commands.
5. ChatGPT
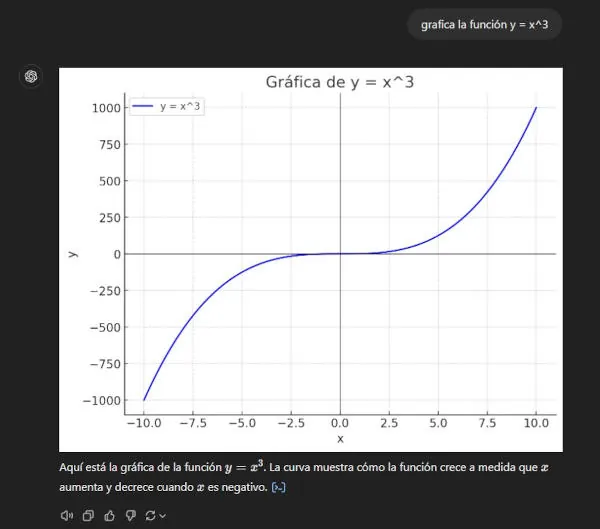
Did you know that ChatGPT can generate mathematical graphs? Yes, this is possible, although it’s not the main specialty of this tool. If you input a function, ChatGPT will show you a simple graph.
If all you need is to see the shape of a curve, this might be enough. If not, you can resort to the other tools featured in this article.
The best way to input an expression in ChatGPT is by using LaTeX syntax, but if you’re not familiar with it, you can still use this tool.
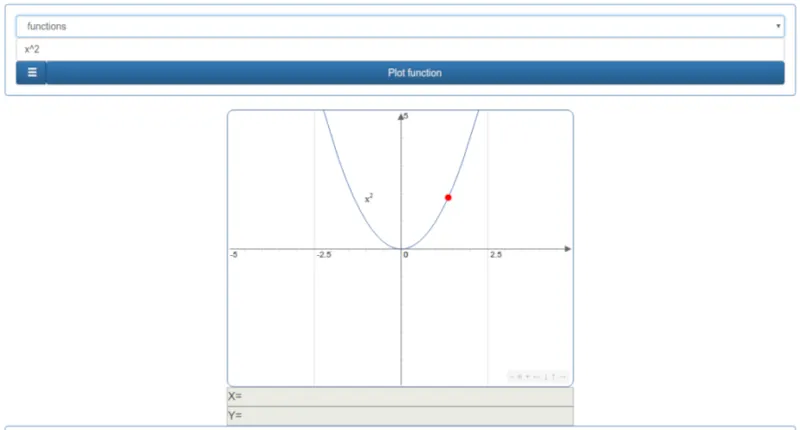
6. Meta-calculator
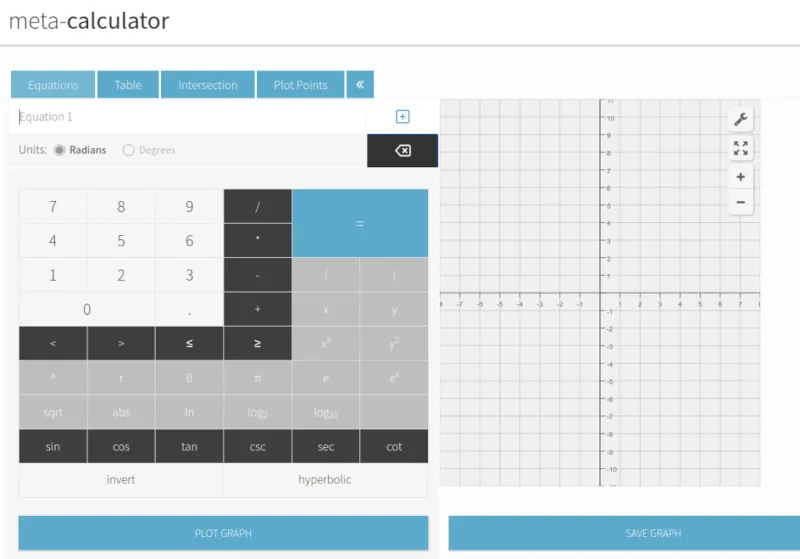
On Meta-Calculator, you’ll find an interesting set of math tools. Among them is a graphing calculator. With this tool, you can draw functions, mark points on the Cartesian plane, and find intersection points between different functions.
The way to input expressions is a bit more basic compared to some of the graphing calculators we’ve seen before. The good thing is that it has a visual interface to select functions and easily build the expression.
7. Mathway
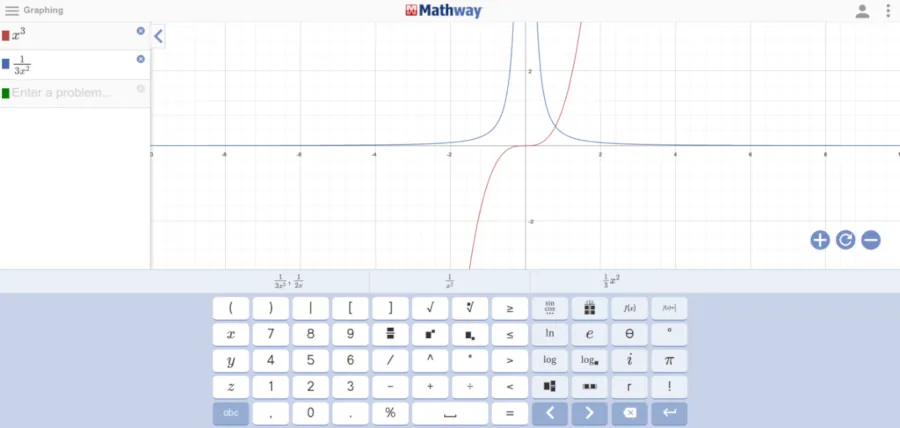
Mathway is a very interesting graphing calculator that can directly compete with Desmos or FooPlot as one of the best. You can graph many functions, and the Cartesian plane occupies the entire screen. It’s possible to move around the graph by dragging the workspace area. Of course, you can also zoom in and out.
The way to input expressions is excellent, and it also has a visual interface as an assistant. In the graphing calculator itself, you won’t find many additional options. However, this tool is part of a larger set of math applications. If you explore the options in the menu, you’ll find useful resources.
8. Graph Sketch
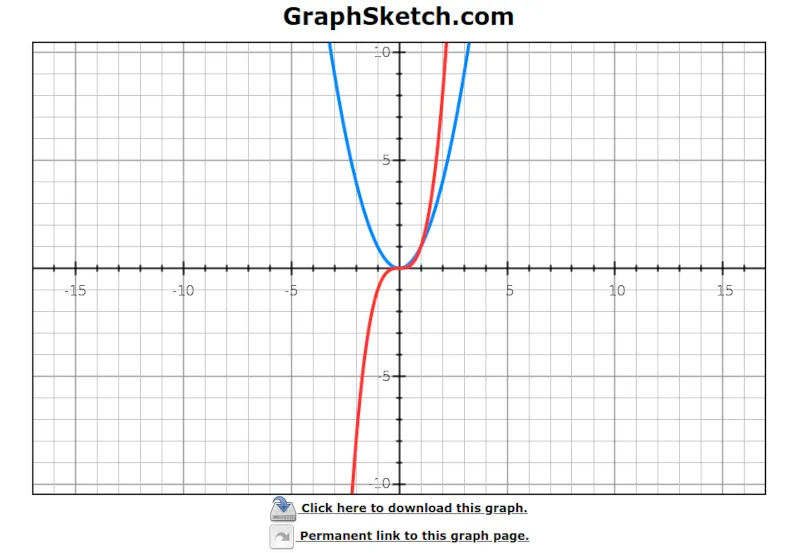
Graph Sketch may not be as visually appealing as some of the previous ones, but it has one feature that makes it special. It exports the graphs to images in a simple and straightforward way, with a large enough size to be inserted into practical assignments and reports.
You will find the Cartesian plane at the top of the page. Below it, there is a form to input the functions.
9. GeoGebra
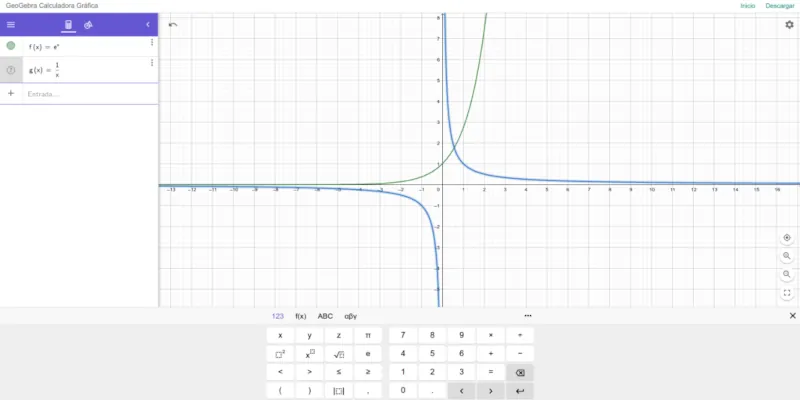
GeoGebra is a suite of mathematical applications that we’ve already discussed on Mentes Liberadas. This time, we will focus solely on the graphing calculator. It is one of the most complete and feature-rich options you’ll find online.
In addition to the basic functions for graphing, you will find a visual interface to input expressions and several tools. Unlike other graphing calculators, with GeoGebra, you can graph directly on the plane. This means you can draw lines, segments, circles, and arcs. It also includes tools for measuring and making intersections.
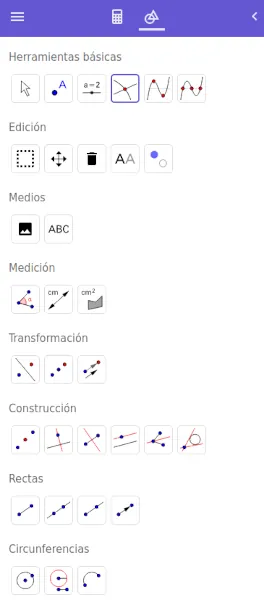
GeoGebra offers too many options to summarize them here. For some, this graphing calculator might be too much. But for others, it can be a powerful tool for studying mathematics, mathematical analysis, or even algebra.
10. Equation Grapher by Math is Fun
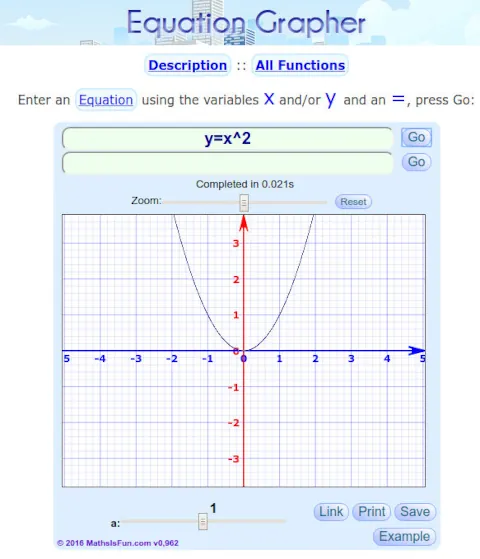
Equation Grapher is a quite small and simple graphing calculator. Keep in mind that you need to include the variable y in the equation when graphing. It allows you to easily export the graph as an image.
11. Rechner online
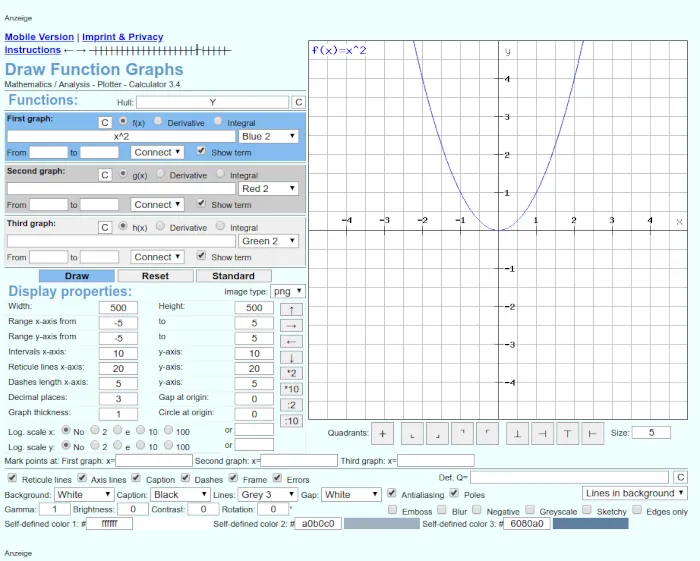
Rechner online is a function graphing calculator with many options. Its main drawback is perhaps that you can’t navigate the Cartesian plane. You have to modify the range in the options provided. The graphs can be saved and later retrieved.
Another disadvantage is that you can only graph up to three functions at once. The good thing is that all these limitations are compensated with more advanced options.
12. GraphFree
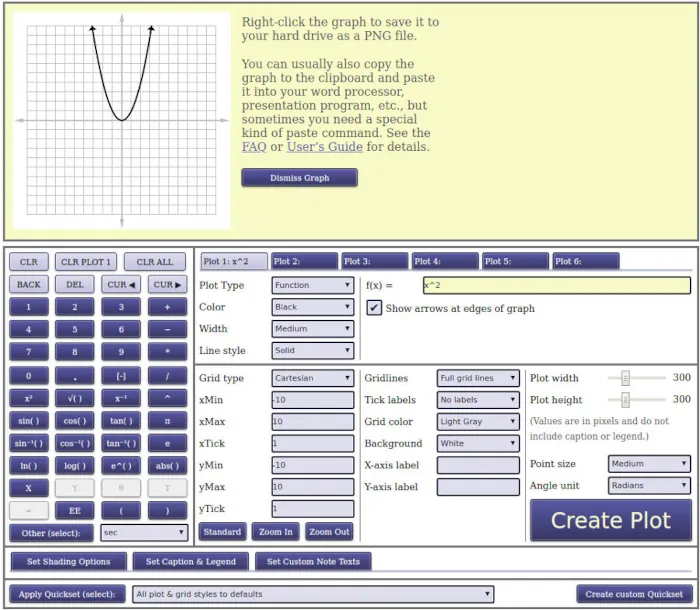
GraphFree is another small graphing calculator but with interesting options. It may be more useful for generating a graph and exporting it as an image than for studying mathematics.
You input the expression and the interval you want to visualize, among many other options, and then the graph is generated, which can be downloaded.
The downside is that the generated graph is 300px x 300px. This is too small to be useful in a report or assignment to submit.
13. Wolfram Alpha
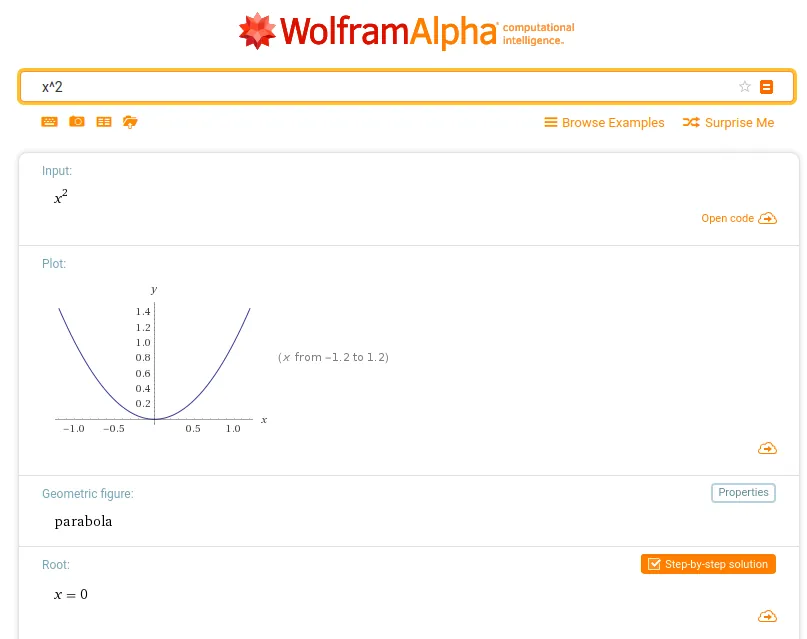
Wolfram Alpha isn’t exactly a graphing calculator. It’s more like a Google for mathematics. It consists of a simple text box where you can make queries in mathematical language.
Among the search results, Wolfram Alpha shows a lot of information related to what you’ve entered. If applicable, it includes a graph. That is, if you enter an equation that can be represented on a Cartesian plane, you’ll see its curve.
It may seem limited compared to the other apps in this post, but remember that often in Calculus or even in Statistics, we only need to see the shape of the curve.
14. eMath Help Math Grapher

eMath Help is a simple graphing calculator, but with just the right features to be quite useful. You can graph multiple functions. It accepts Cartesian, parametric, and polar coordinates, among other ways to input expressions.
The major drawback is that you can’t freely navigate the Cartesian plane. That is, you have to specify the interval in which the function is visible. Otherwise, you won’t see it.
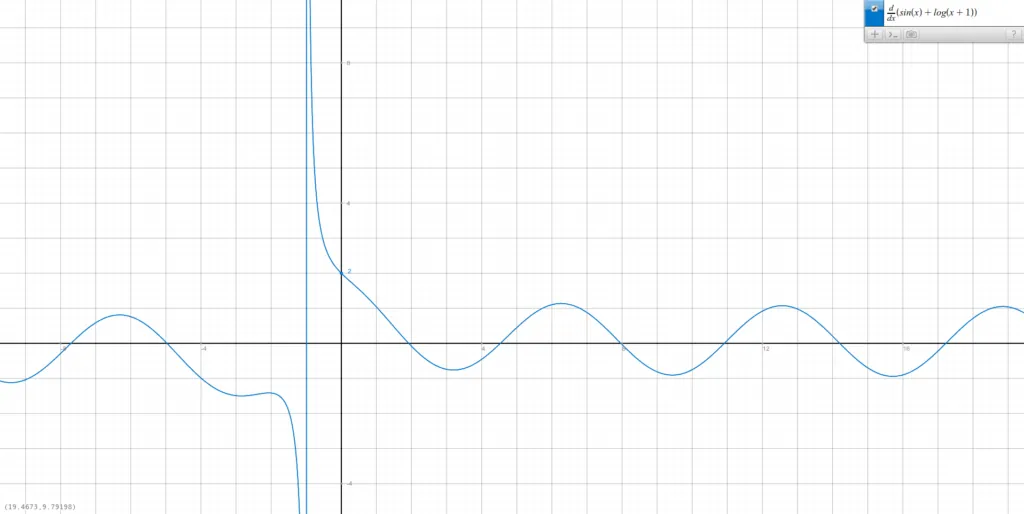
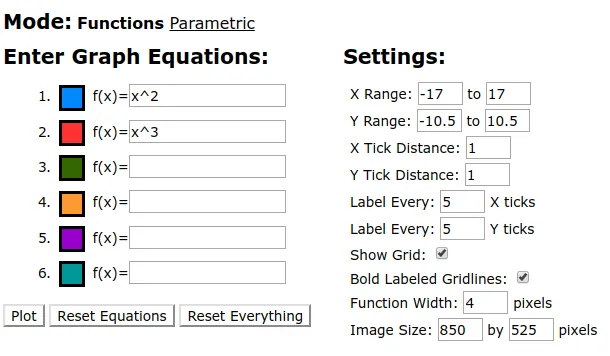
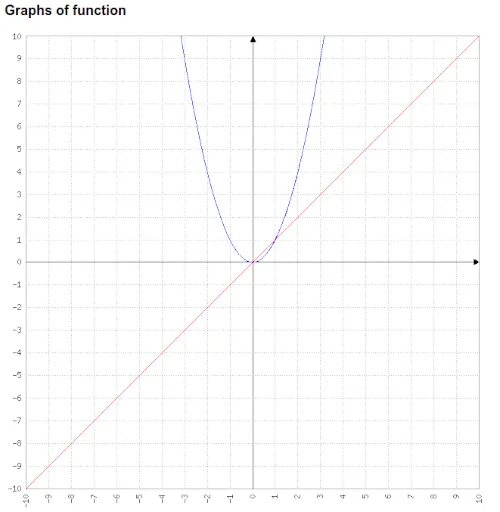
15. Online Graph Plotter
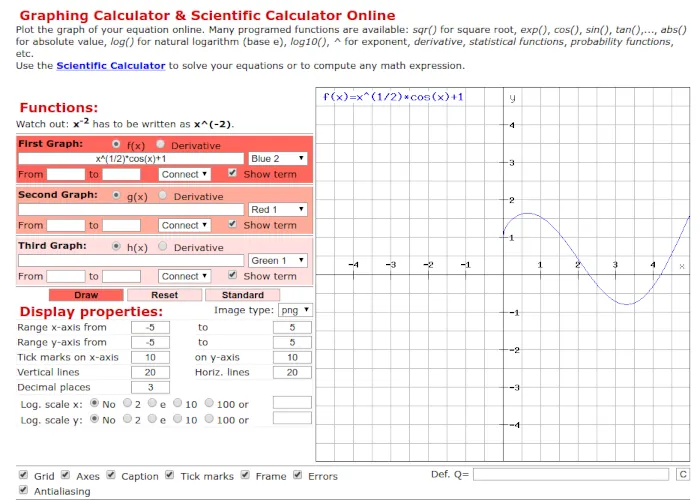
Online Graph Plotter is a graphing calculator that may not look very appealing at first, but it gets the job done. You need to define the interval to find the function, and it has some of the same limitations as the previous ones. It might be more useful for more complex tasks like graphing derivatives. It allows you to choose from a wide range of colors for each graph.
16. SoluMaths
SoluMaths is a simple graphing calculator but with interesting options like writing the function in Cartesian, polar, or parametric coordinates.
17. MAFA Function Plotter
MAFA Function Plotter is another function graphing tool that can be useful for plotting a function and then exporting it. It generates a good-sized image for insertion into Google Docs, Word, or LibreOffice. It is available in different languages.
In summary
It can be said that FooPlot, GeoGebra, and Desmos are superior to the rest due to the number of options they offer. However, it’s also useful to have the others as alternatives.
ChatGPT can be helpful if you use it regularly and only need to see the shape of a curve.
Find more content on Mentes Liberadas
That’s all for this article. I hope you enjoyed it.
You can make a donation to Mentes Liberadas through our Ko-Fi account. This way, you’ll be supporting the site, helping us create more content, resources, and online tools.
Thank you for taking the time to read.
See you in the next article on Mentes Liberadas.


